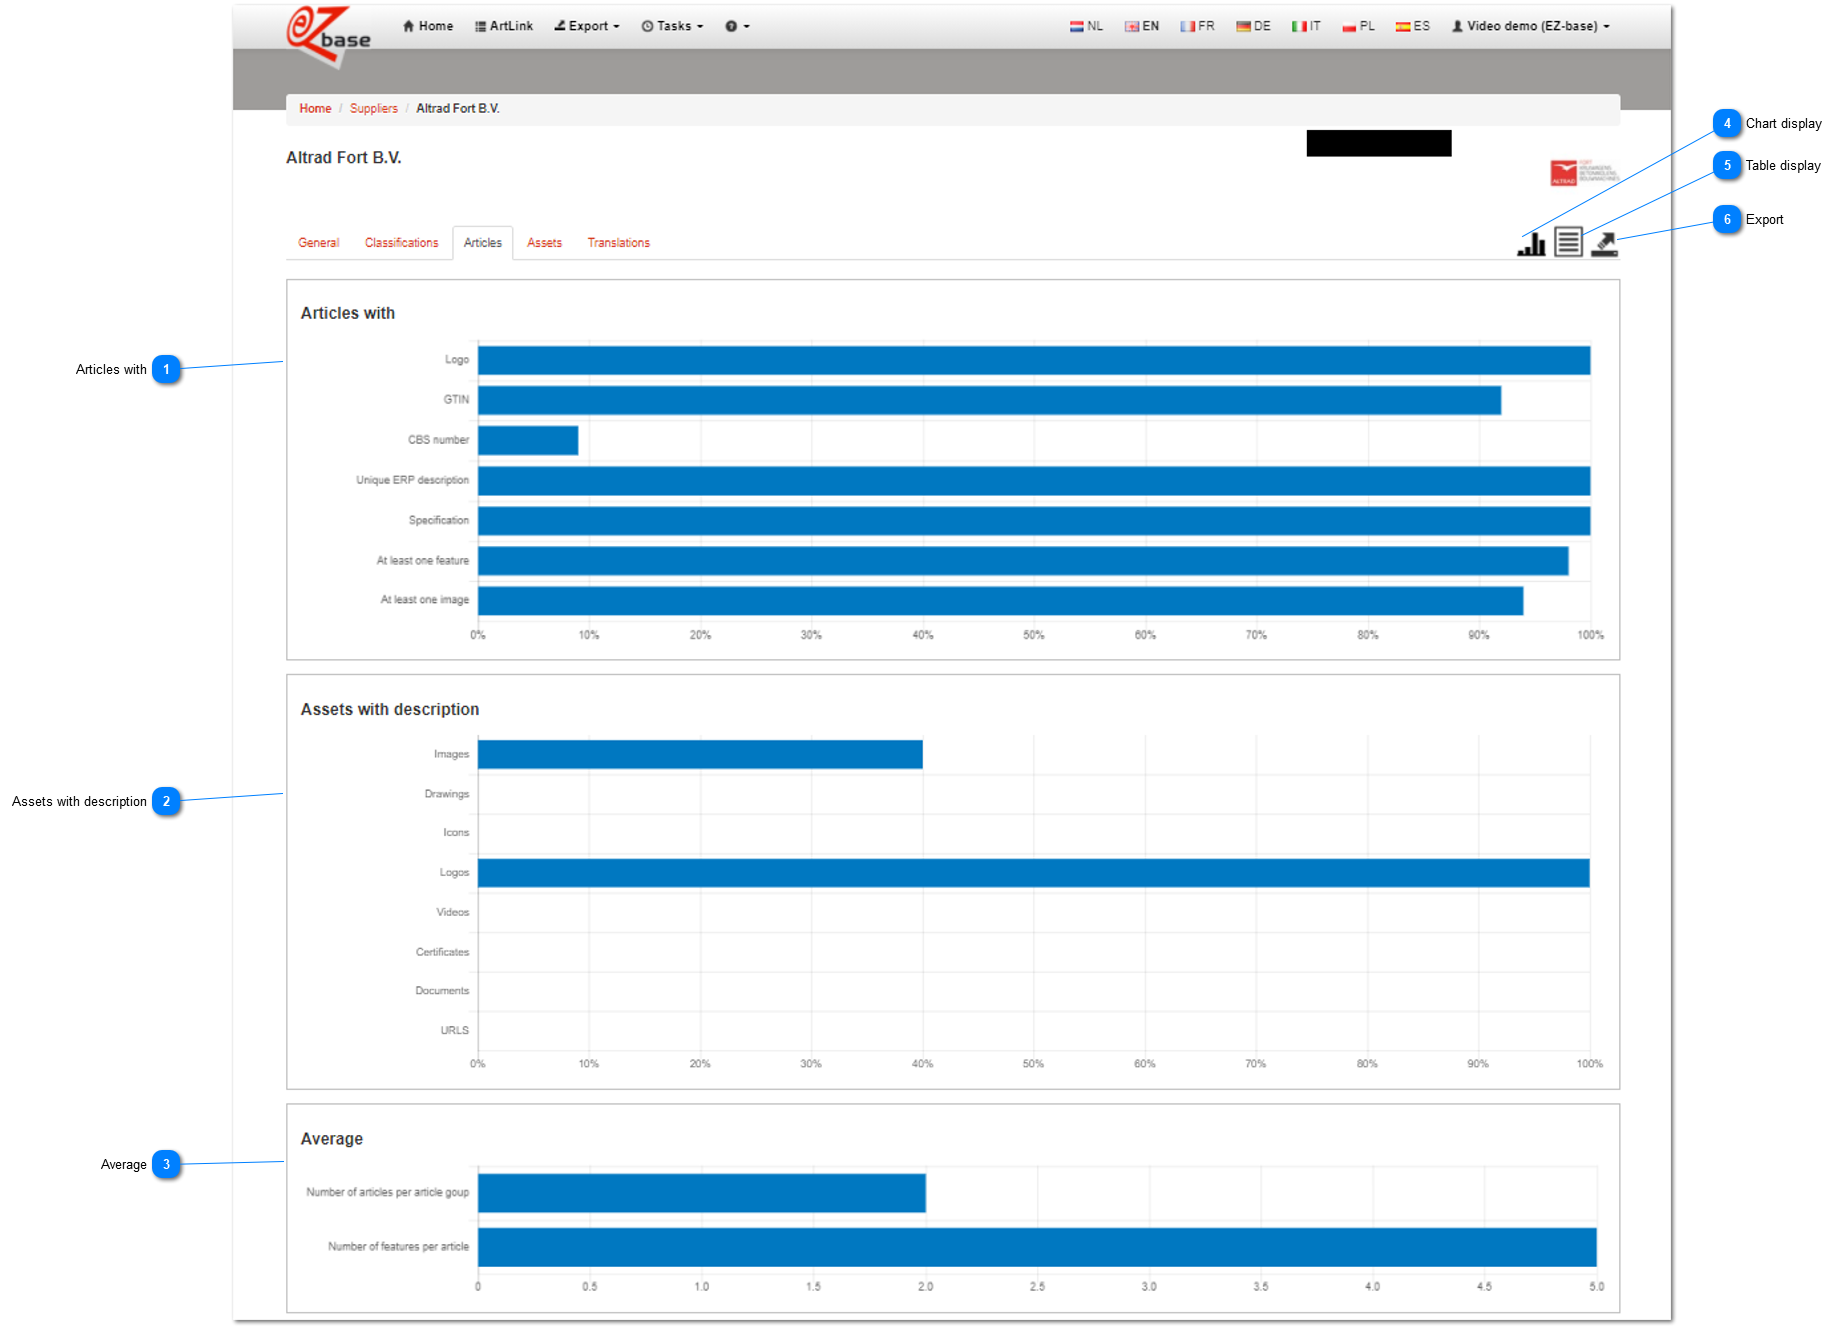
This tab page contains information about the available article information of this supplier.
These numbers give a total overview of this supplier in the selected data language, regardless of the autorizations for te logged in user.
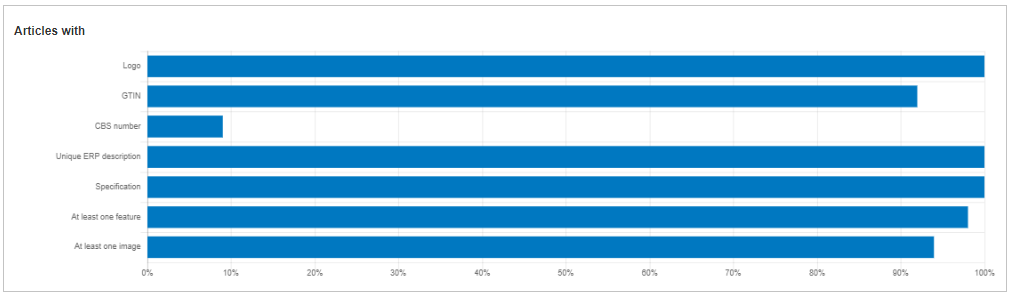
 Articles withThis chart gives information about the most important data of an article.
If you hover over the chart with your mouse, the concerning field and the corresponding filled/linked percentage of articles is shown:
|
Logo
|
The percentage of articles with a linked logo.
|
|
GTIN
|
The percentage of articles with a filled GTIN.
|
|
CBS number
|
The percentage of articles whit a filled CBS number.
|
|
Unique ERP description
|
The percentage of articles with a filled unique ERP description. Considering the importance of a unique ERP description per article, only unique descriptions are counted here.
|
|
Specification
|
The percentage of articles with a filled specification.
|
|
At least one feature
|
The percentage of articles with at least one feature.
|
|
At least one image
|
The percentage of articles with at least one linked image.
|
Click here for the explanation of the different terms used. |
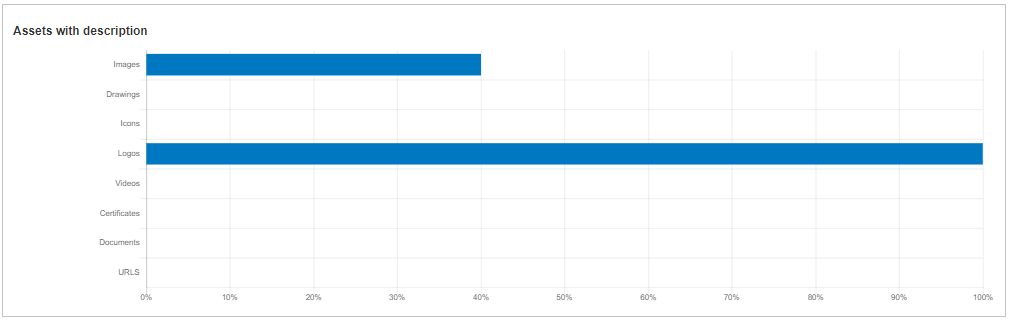
 Assets with descriptionSeveral assets kan be linked per article. In this chart you can find the percentage per asset implementationtype of all these linked assets whith which the asset is provided with a description. Click here for additional information about asset descriptions. If you hover over the chart with your mouse, the concerning field and the corresponding filled/linked percentage of articles is shown:
|
Images
|
The percentage linked images with a filled description.
|
|
Drawings
|
The percentage linked drawings with a filled description.
|
|
Icons
|
The percentage linked icons with a filled description.
|
|
Videos
|
The percentage linked videos with a filled description.
|
|
Embeddables
|
The percentage linked embeddables with a filled description.
|
|
Certificates
|
The percentage linked certificates with a filled description.
|
|
Documents
|
The percentage linked documents with a filled description.
|
|
URLs
|
The percentage linked URLs with a filled description.
|
|
Logos
|
The percentage linked logos with a filled description.
| |
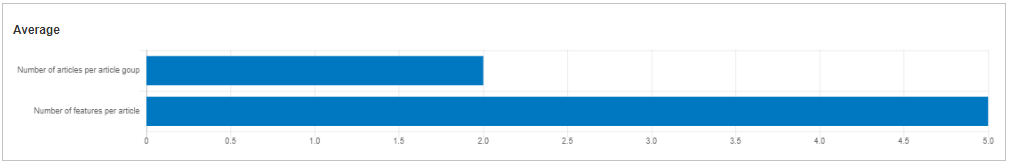
 AverageThis chart shows two important averages.
AIf you hover over the chart with your mouse, the concerning field and the corresponding filled/linked percentage of articles is shown:
|
Number of articles per article group
|
|
|
Number of features per article
|
The average number of features per article. | |
 Chart displayThis is the default display.
After choosing this button, the tables will be displayed as charts. Only this way of displaying is stated in the EZ-manual.
|
 Table displayAfter choosing this button, all charts will be displayed as tables.
|
 ExportWith this button the dashboard data can be exported. The result can be viewed in On-going tasks. From this screen the dashboard data will always be exported vertically. Click here for an example. It is also possible to export the dashboard data horizontally. Go to Suppliers. |