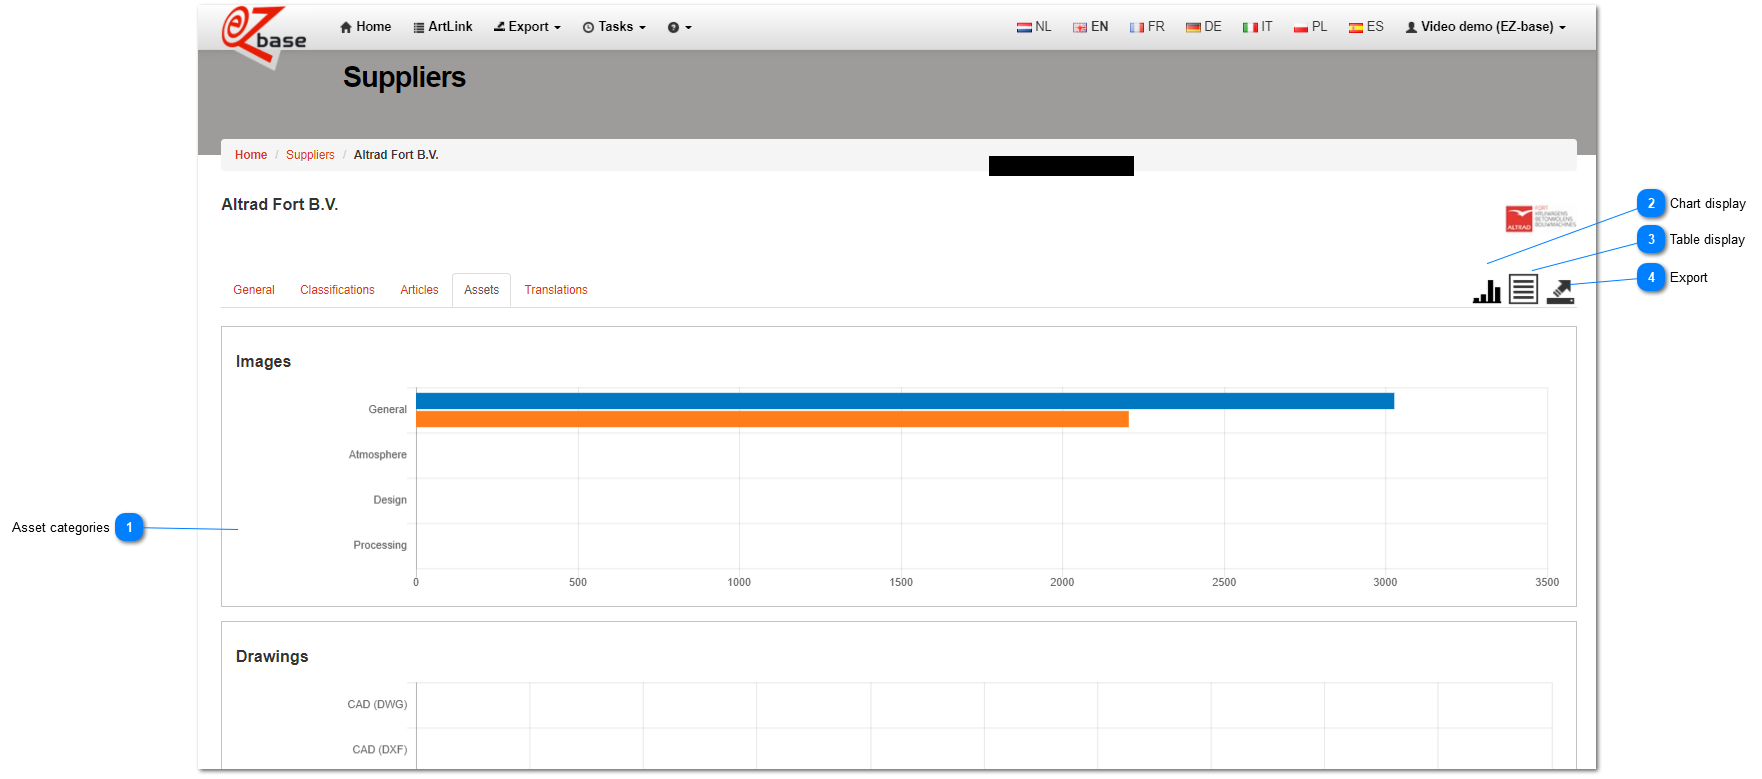
This tab page contains information about the available asset categories of this supplier.
These numbers give a total overview of this supplier in the selected data language, regardless of autorizations for the logged in user.
Asset categories
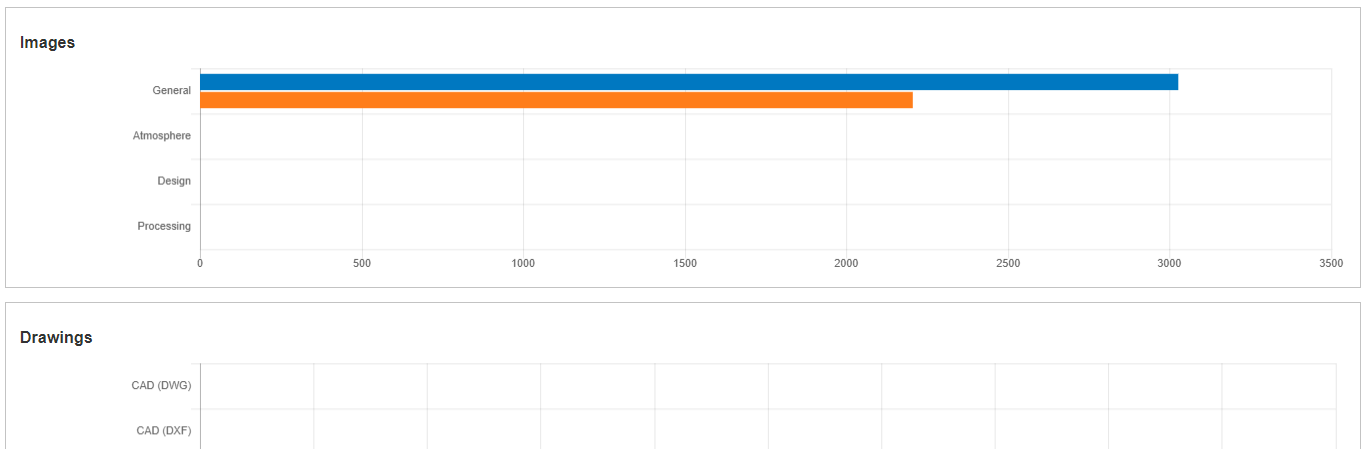
All assets are divided in asset implementationtypes. In this tab page all available categories are stated per type with following:
In blue
The total number of linked assets in this category for this relation.
In orange
The number of unique assets in this category for this relation.
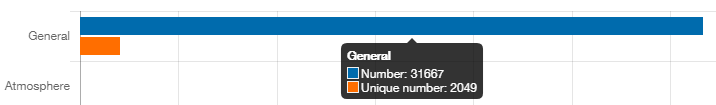
For example: there is one general video available. This video is linked to all two-thousand articles. Blue (number) is 31667 and orange (unique number) is 2049.
If you hover over the chart with your mouse, the concerning category and both numbers is shown:
Assets linked at article level are counted: assets linked at group level are not counted. The exception is Logo which, on the contrary, is linked by group and counts for every article in the group.