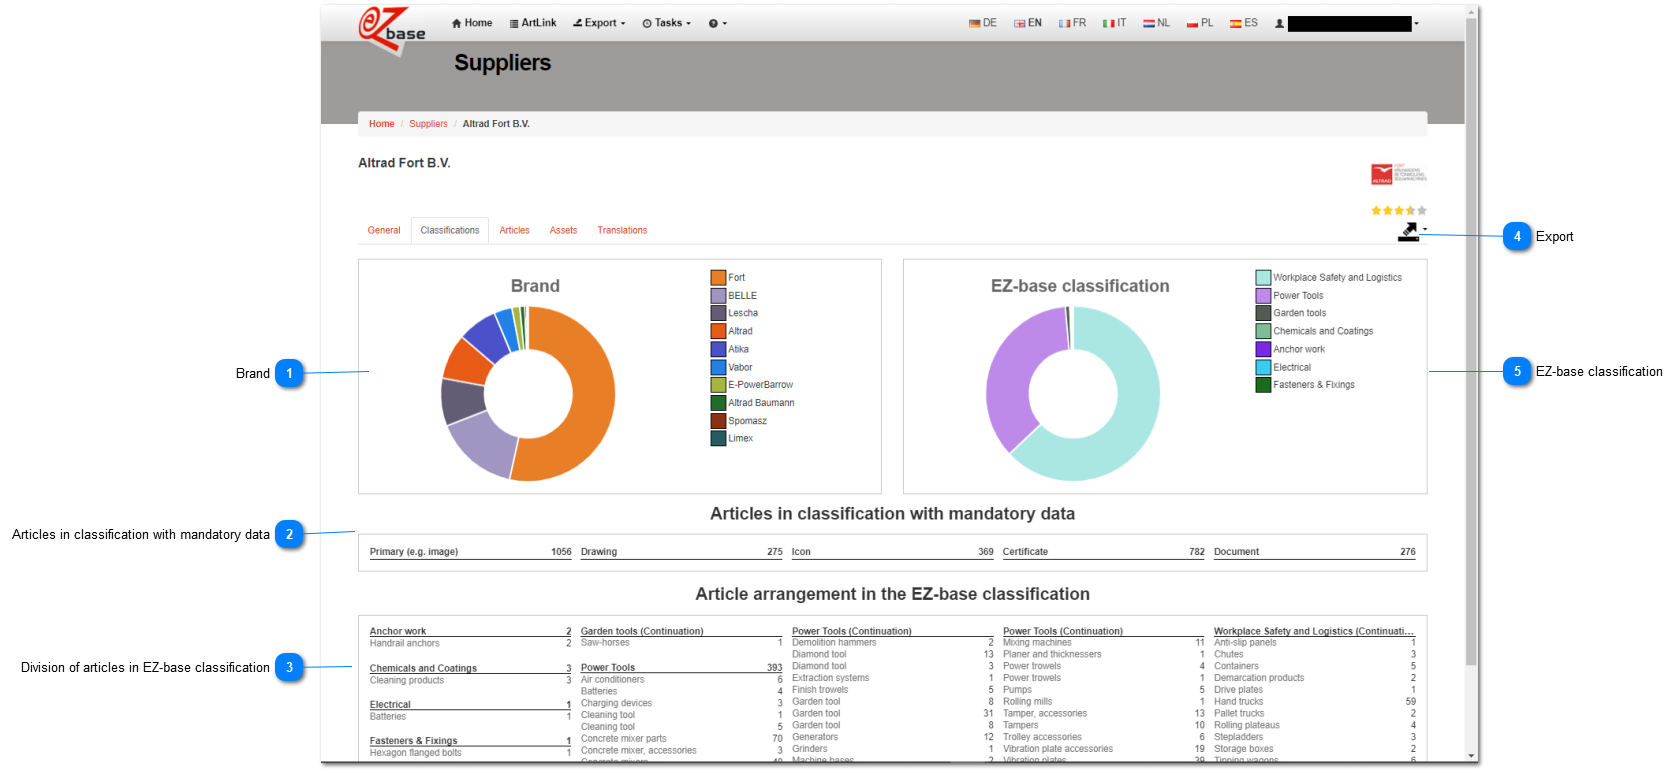
This tab page contains information about, amongst other, the division of articles of this supplier in the EZ-base classification.
These numbers give a total overview of this supplier in the selected data language, regardless of autorizations for the logged in user.
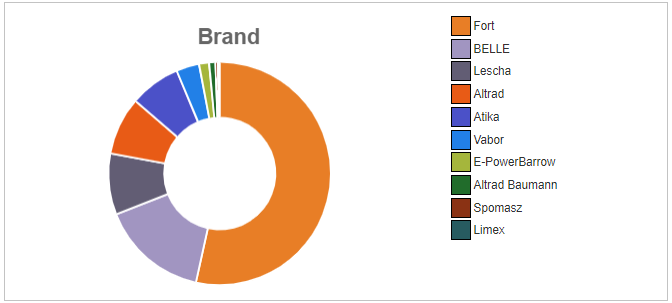
 BrandThis chart shows the subdivision of articles in brands.
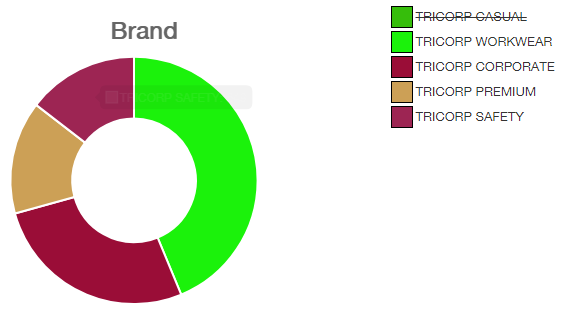
On the right you see the chart legend, sorted by number of articles: the most appearing are listed at the top. If a brand is selected in the legend, this will be stroke out and not be shown anymore in the chart:
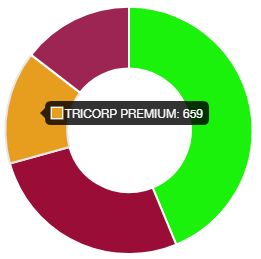
If the mouse hovers above the chart, the brand and number of articles within this brand is shown:
|
 Articles in classification with mandatory data
Per classification, certain data may be mandatory to provide. The better a supplier has provided this mandatory data, the higher the Data Evaluation. Click here (under the heading EZ-base classification) to see which classifications require the data listed below: - Primary: for articles classified in this classification, the primary data evaluation subjects must be filled. For example, at least one image per article is mandatory. Primary subjects at this time are: Articles with specification, Articles with at least one feature, Articles with at least one image, Images, Videos, URLs. Here, the number of primary articles is used as RelativeData. Not primary are the classifications where, for example, parts are classified: here these primary data valuation subjects are less important. |
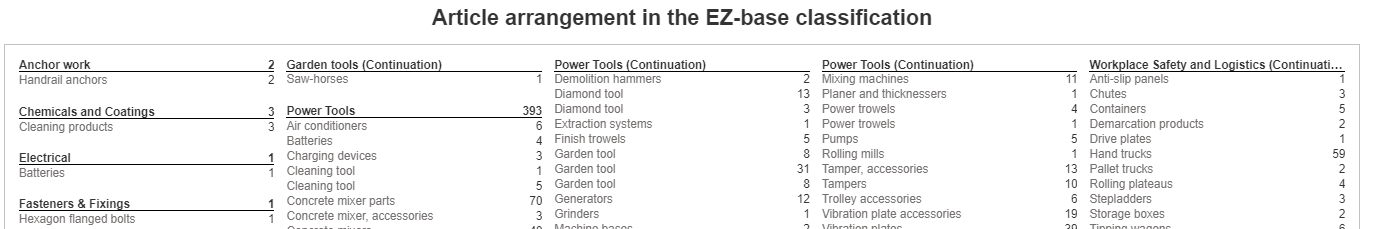
 Division of articles in EZ-base classificationIn this overview the number of articles are shown:
-
on the first level of the EZ-base classification of (printed bold an underlined). -
under that on the third level of the EZ-base classification. This third level is also al link to the Product tab page where this selection is shown. Due to autorizations it can happen that the numbers in the dashboard are higher than what the logged in user sees. In that case the following message is shown:
Because the second classification level is not shown in this overview, it may occur that two identical descriptions are stated under each other. For example: Freesmachines (level 3) appear in two different classification levels 2: as accugereedschap and as elektrisch gereedschap, and can therefore appear double in this overview.
|
 ExportWith this button the dashboard data can be exported. The result can be viewed in On-going tasks. From this screen the dashboard data will always be exported vertically. Click here for an example. It is also possible to export the dashboard data horizontally. Go to Suppliers. |
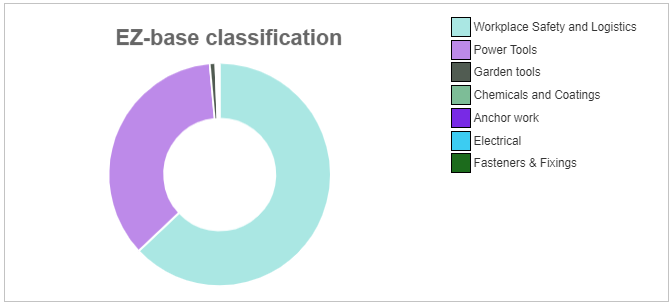
 EZ-base classification
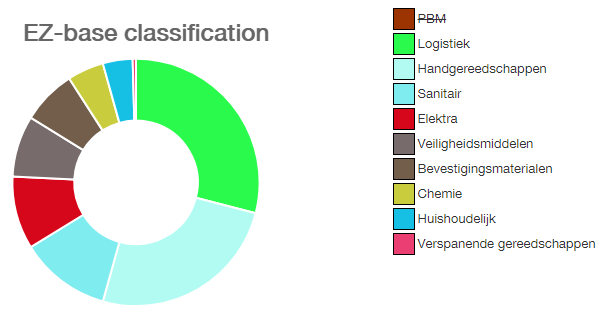
This chart shows the subdivision of articles in the highest EZ-base classification level.
On the right the chart legend is visible, sorted by number of articles: the most appearing classifications are listed at the top. If a classification is selected in the legend, it will be stroke out an not be shown in the chart anymore.
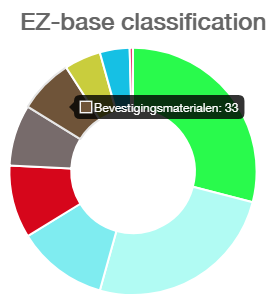
If the mouse hovers above the chart, the classification name and number of articles within this classification is shown:
|
|